As a system integrator, managing metrics to benchmark progress and identify ways to improve is important for driving profitable sales — and the growth of the company.
Recently, we sponsored a customer impact study for System Surveyor to gather data on a few questions — how do you measure the success of investing in digital site surveys and system design, and management? What is the return on using our software platform?
Several of the integrators were able to measure these directly in three core metric areas. Others said, “Gosh, maybe I don’t measure this as much as I should. Do I know as much as I should about the time it takes our sales team to get a proposal completed, our win rate, and our profit margin?”
Today’s post looks at the importance of these metrics and why improving them is essential for any size system integration business.
3 key success metrics for system integrators
1. Sales Efficiency: Average SI spends 15 hours on proposals
Sales efficiency is a metric of how quickly and effectively your team can secure a sale. If the pre-sale process is taking weeks between drafting up a proposal and going back and forth with revisions, this will bear a significant cost and burden on the ability to sell services efficiently and effectively.
We can confirm this from our Benchmark Report and our every-day conversations with hundreds of SI leaders. The very first thing I ask someone when we’re doing a demo for System Surveyor: “How long would it take you to do a site survey and create the very first proposal with someone?” Our data shows that for the average integrator, it’s 15 hours per proposal. That’s a lot.
In fact, the other day I was talking with a security rep that serves Fortune 500 companies and large campuses. I asked her how long it takes her to do a proposal. Her response? “It will take me an entire week.” Digging a little further, I asked, “You mean a couple of hours each day for that week?” and she shook her head, saying, “No, it takes every working hour of my day for an entire week.”
So let’s just say that’s around 30 hours. But there’s more, what happens when the customer says, “That wasn’t really what I was thinking”? The average integrator has to go back 3-4 times before a proposal is ready to sign off which can take weeks. Every day, SIs tell us they want to streamline this process, but it is key to benchmark it first.
Sales efficiency is best utilized as a metric when it’s measured in hours. It’s also important to ask: How many people is this impacting? Is it 10 hours for the sales person? A few hours for engineering? How many for project management? What is the workflow?
Oftentimes when SI leaders step back, they experience the “uh oh” moment. “I can’t believe how inefficient this process is, I mean, we’ve been doing it that way for so long, I didn’t know there was another option.”
This is not terribly difficult to benchmark with the team but it can uncover some clear opportunities for improvement. Just think, if it takes 15-20 hours for a proposal, weeks to close (while competition is lurking), and the company loses the deal – that opportunity cost can’t be recovered. A critical metric to be sure.
2. Sales Close Rate: Visualizing with Customers Early in the Journey Improves Win Rate by 20%
Remember the rep above who said it takes an entire week for an initial proposal? That certainly was not good news to the sales VP but what concerned him even more is the sales close rate. When I share the statistic that System Surveyor users improve sales win rates by up to 20%, heads are turned.
The average system integrator only wins 1 out of 3 proposals. Why are they not winning all three? We’ve covered that here. For a recap: it all comes down to customer engagement. Are you designing for a customer or with them? Customers want a partner that designs “with” them. They want a partner that provides the opportunity to visualize system design, gather their direct feedback, and who shares a proposal quickly and directly on point the first time around (or with very minor revisions). If you’re able to build confidence early on in the process, competitive bids are less likely.
A higher win rate is typically a sign that you’re getting it right early on in the customer journey and building trust.
Quote: “I’ve been using System Surveyor for 2 years now and it’s great. Most of the time, I use it live with my customers and they feel like they’re part of the design.”
Higher win rates also come from referrals from happy customers. When a satisfied customer refers a colleague to you; the potential win rate goes up. This is called the “fly-wheel” effect. That means that the person referring is trusted by their colleague. By that very nature, you have a leg up on the competition. But, we beware, you must deliver as good or better customer experience to keep the fly-wheel going,
Whether you’re an absolutely referral-based business or invest in marketing, advertising, etc, there is always an investment of time, effort and money.. Therefore, anything you can do to improve the return of investment for these efforts is golden. So once you’ve analyzed your sales efficiency, it’s time to look at the results — are you winning the projects that you’re spending so much time proposing? Are you current customers referring others to you?
3. Gross Profit Margin: Better Site Surveys Mean 10% Improvement in Margins
Once you’ve analyzed sales efficiency and close rates, it’s time to focus on gross profit.
Many companies measure and compensate their sales people based on gross profit margin, some don’t. Just because you win business, doesn’t mean it is profitable.
There are a few aspects to improving profit margins: 1) Aligning to customers needs and understanding expectations clearly, 2) accurate estimations and proposals, 3) excellent communication from pre-sales through post sales.
Of course, this topic could be a blog post all in it’s own but we’ll simplify here. First, does your organization evaluate profit margins? Are they tight and does your team know why? If you’re satisfied, stop reading. If not, there may be opportunities for improvement.
I’ve been told by our partners that the “healthiest integrators” use System Surveyor. Why are they so healthy? Because they start by better understanding their customer’s needs at the first point in the journey: the site survey. Capturing customer requirements on a yellow pad, cell phones, in your head, and on Visio amplifies the risk of poor profit margins. It reduces the ability to effectively communicate to the next part of the workflow without missing vital information.
No charge change orders and unanticipated truck rolls chip away at profit margins. Workflow, collaboration and better digital communication are essential to protecting margins. A fine oiled machine is the answer to delivering the promise made to customers. A systematic workflow is required— so it’s important to look under the covers at your own organization at every step: the site survey, the hand-off to the engineering team, the hand-off to operations and technicians, etc. Every single point of that process is an opportunity for margin health or loss.
Summary
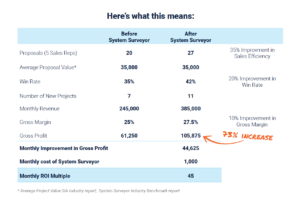
These three metrics are integral to monitoring success for any system integrator — and if you address all three of these things with modern system design and management software, you can see a 73% increase in gross profit.
Learn more, download our Customer Impact Study.
Sign up for aFree Starter Account for up to 5 people on your team.
Be sure to benchmark a few simple things before you begin and then check if there are improvements. This investment can pay back serious dividends.
Be sure to benchmark a few simple things before you begin and then check if there are improvements. This investment can pay back serious dividends.